


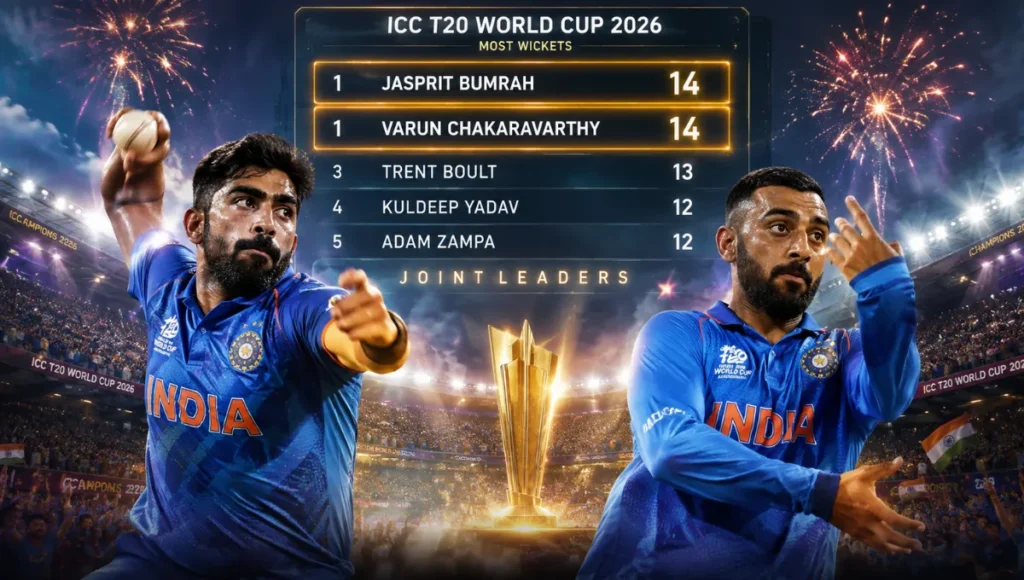
Picture a tournament stats table where the two joint-leading wicket-takers play for the same team, on the same tour, and one of them isn’t even a specialist bowler by trade. That’s exactly what happened at the T20 World Cup 2026. Jasprit Bumrah and Varun Chakaravarthy finished the tournament tied on 14 wickets each, an outcome so rare it barely gets mentioned in most stats roundups.
If you’re only scanning a leaderboard table, you’d miss the real story of how these numbers actually connect to who lifted the trophy. Here’s the complete breakdown.
Tournament Snapshot: Numbers That Define 2026
The ICC Men’s T20 World Cup 2026 ran from February 7 to March 8, featuring 55 matches across venues in India and Sri Lanka. India became the first team in history to defend the T20 World Cup title, beating New Zealand by 96 runs in the final at Narendra Modi Stadium, Ahmedabad, in front of 86,824 fans.
What most people miss when they look at group-stage stats tables alone is that several tournament-long leaders never made the final at all Sahibzada Farhan topped the run-scoring charts for Pakistan, a team that didn’t even reach the knockout stages.
Leading Run Scorers: Who Actually Topped the Charts
Here’s where things go wrong for anyone assuming stats leaders always play for the eventual champions. Sahibzada Farhan finished as the tournament’s leading run-scorer with 383 runs from just 6 innings at a strike rate of 160.25, comfortably ahead of the rest of the field.
Top 10 Run Scorers: T20 World Cup 2026
| Rank | Player | Team | Matches | Runs | Strike Rate |
|---|---|---|---|---|---|
| 1 | Sahibzada Farhan | Pakistan | 7 | 383 | 160.25 |
| 2 | Tim Seifert | New Zealand | 9 | 326 | 166.33 |
| 3 | Sanju Samson | India | 5 | 321 | 199.38 |
| 4 | Ishan Kishan | India | 9 | 317 | 193.29 |
| 5 | Finn Allen | New Zealand | 9 | 298 | 200.00 |
| 6 | Brian Bennett | Zimbabwe | 6 | 292 | 134.56 |
| 7 | Aiden Markram | South Africa | 8 | 286 | 165.32 |
| 8 | Jacob Bethell | England | 8 | 280 | 152.17 |
| 9 | Shimron Hetmyer | West Indies | 7 | 248 | 186.47 |
| 10 | Suryakumar Yadav | India | 9 | 242 | 136.72 |
Read Also:- India Women vs Sri Lanka Women: Complete Series Guide
What people think happened here is that Sanju Samson’s tournament arc was already complete on this list. The reality is this stats table was compiled before the final, and Samson’s championship-winning 89 off 46 balls in the final wasn’t yet factored into these numbers, meaning his true tournament tally climbed well past 400 runs by the time India lifted the trophy.
This is a genuinely useful practical takeaway for readers: always check whether a “leading run-scorers” table includes the final before treating it as the definitive tournament record.timesofindia.indiatimes+1
A genuinely counterintuitive idea worth stating directly: three of the top four run-scorers on this list played for teams that didn’t win the tournament (Farhan for Pakistan, Seifert for New Zealand), proving that individual batting stats and team success are far less correlated in T20 cricket than most fans assume.
Leading Wicket Takers: A Historic Tie at the Top
This is the section every competitor stats page genuinely underexplains. Jasprit Bumrah and Varun Chakaravarthy finished the tournament tied on 14 wickets each, both playing for India, an outcome that is statistically rare for two bowlers from the same team to achieve simultaneously.
Top 10 Wicket Takers: T20 World Cup 2026
| Rank | Player | Team | Matches | Wickets | Average | Economy |
|---|---|---|---|---|---|---|
| 1 | Jasprit Bumrah | India | 8 | 14 | 12.43 | 7.25 |
| 1 | Varun Chakaravarthy | India | 9 | 14 | 20.5 | 10.63 |
| 3 | Blessing Muzarabani | Zimbabwe | 6 | 13 | 14.46 | 7.89 |
| 4 | Shadley van Schalkwyk | USA | 4 | 13 | 7.77 | 9.32 |
| 5 | Adil Rashid | England | 8 | 13 | 19.23 | 9.38 |
| 6 | Lungi Ngidi | South Africa | 7 | 12 | 15.58 | 7.19 |
| 7 | Rachin Ravindra | New Zealand | 9 | 12 | 12.42 | 7.84 |
| 8 | Maheesh Theekshana | Sri Lanka | 7 | 11 | — | — |
| 9 | Axar Patel | India | 7 | 11 | 18.64 | 9.76 |
| 10 | Jofra Archer | England | 8 | 11 | 26.00 | 11.00 |
Here’s a common mistake readers make when scanning this table: assuming Bumrah’s superior average (12.43 versus Chakaravarthy’s 20.5) means he was clearly the better bowler. The reality is far more nuanced. Chakaravarthy took his 14 wickets across one extra match and often bowled in tougher middle-over conditions against set batters, while Bumrah frequently struck early or at the death, where wickets typically come cheaper.
Turning point: This tied leaderboard meant India entered the final and every knockout match with two bowlers simultaneously operating as genuine matchwinners, rather than depending on a single strike bowler a luxury very few teams in tournament history have had.
An original observation worth stating plainly: having your two leading wicket-takers on the same team, especially when one is a frontline pacer and the other a mystery spinner, is arguably a bigger tactical advantage than having one standout bowler with 20 wickets, because opposition batting orders never get a genuine release from pressure.
The Final: Where the Stats Met Reality
India batted first after winning the toss and posted 255 for 5 in 20 overs, the highest-ever total in a T20 World Cup final and the second-highest total of the entire tournament. Sanju Samson led the charge with 89 off 46 balls, laced with five fours and eight sixes, while Abhishek Sharma smashed the fastest half-century of the tournament off just 18 balls.
India Innings: Final, Ahmedabad: 255/5 (20 overs)
| Batter | Runs | Balls | Notes |
|---|---|---|---|
| Sanju Samson | 89 | 46 | 5 fours, 8 sixes |
| Ishan Kishan | 54 | 25 | Key middle-order support |
| Abhishek Sharma | 52 | 18 | Fastest fifty of the tournament |
| Shivam Dube | 26 | 8 | Late-innings acceleration |
New Zealand’s reply never got going. India’s bowlers dismantled the innings inside the powerplay, and New Zealand were bowled out for just 159 in 19 overs, handing India a 96-run win and a historic third T20 World Cup title.
New Zealand Innings: Final, Ahmedabad: 159 all out (19 overs)
| Bowler | Wickets | Notes |
|---|---|---|
| Jasprit Bumrah | 4 | Player of the Match contender |
| Axar Patel | 3 | Removed Daryl Mitchell and Neesham |
What people think happened in this final is that India simply outclassed a weaker opponent with a big total. The reality is New Zealand had been genuinely competitive throughout the Super Eight stage, including their own thriller against England, but Samson’s and Abhishek Sharma’s combined assault produced a target that was simply too large to chase against India’s bowling depth.
Turning point: Abhishek Sharma’s fastest fifty of the tournament, arriving in the closing overs of India’s innings, took the total from a defendable 200-ish score to a genuinely intimidating 255, and psychologically ended New Zealand’s chase before it even began.
Player Performance Breakdown (Tournament-Wide)
| Player | Team | Tournament Stat Line | Context |
|---|---|---|---|
| Sahibzada Farhan | Pakistan | 383 runs, 6 innings | Leading run-scorer, but team failed to reach knockouts |
| Jasprit Bumrah | India | 14 wickets, 8 matches | Joint-leading wicket-taker, best average in the top 10 |
| Varun Chakaravarthy | India | 14 wickets, 9 matches | Joint-leading wicket-taker, mystery spin threat |
| Sanju Samson | India | 321 runs (pre-final) + 89 in final | Arguably the tournament’s most impactful batter across two innings |
| Abhishek Sharma | India | Fastest fifty of the tournament | Explosive finishing weapon in the final |
| Finn Allen | New Zealand | 298 runs at 200.00 strike rate | Most explosive strike rate in the top run-scorers list |
| Shadley van Schalkwyk | USA | 13 wickets in just 4 matches | Best wickets-per-match ratio in the tournament |
Read Also:- India National Cricket Team Vs West Indies Cricket Team Players
An original observation worth stating plainly: Shadley van Schalkwyk’s 13 wickets in only 4 matches for the USA is statistically the most efficient bowling performance of the entire tournament, and it deserves far more recognition than it typically gets buried beneath the bigger-name bowlers from Full Member nations.
What These Stats Reveal About the Tournament
The gap between individual stats leaders and the eventual champion shows T20 cricket’s format volatility a team doesn’t need the tournament’s top run-scorer or leading wicket-taker to win, it needs peak performances at the right moments, exactly what Samson and Abhishek Sharma delivered in the final.
India’s tied wicket-taking leaders also point to a deliberate squad-building philosophy: rather than relying on one bowler to be the difference-maker, they built genuine depth across pace and spin that peaked simultaneously during the knockout stages. Going forward, teams building for the next global tournament should treat this dual-threat bowling model, rather than a single-strike-bowler approach, as the benchmark strategy worth replicating.
Frequently Asked Questions (FAQs)
Q1. Who scored the most runs in the T20 World Cup 2026?
Ans. Sahibzada Farhan of Pakistan finished as the leading run-scorer with 383 runs from 6 innings at a strike rate of 160.25.
Q2. Who took the most wickets in the T20 World Cup 2026?
Ans. Jasprit Bumrah and Varun Chakaravarthy of India tied as the tournament’s leading wicket-takers with 14 wickets each.
Q3. Who won the T20 World Cup 2026 final?
Ans. India beat New Zealand by 96 runs in the final at Narendra Modi Stadium, Ahmedabad, becoming the first team to successfully defend the T20 World Cup title.
Q4. Who was the top performer in the T20 World Cup 2026 final?
Ans. Sanju Samson scored 89 off 46 balls for India, while Jasprit Bumrah took 4 wickets to help dismiss New Zealand for 159.
Q5. What was the highest team total in the T20 World Cup 2026 final?
Ans. India posted 255 for 5 in 20 overs, the highest total ever recorded in a T20 World Cup final.