
India were 262 for 4, chasing 258, comfortably in control. That was July 11, the first ODI of the summer, and it looked like a normal day’s work for the world’s No. 1 ranked side. Eight days later, India were bowled out for 360 chasing 388 at Lord’s, and England had the series.
What most people miss is that the number “360” looks like a batting failure on a scoresheet, but it was actually India’s second-highest score in a losing ODI chase a stat no scorecard shows you by itself.
That’s the problem with reading these games one scorecard at a time. Nine matches, one rivalry, and the full story only shows up when you put every card side by side.
Quick Answer: All Nine Results
| Match | Format | Venue | Result |
|---|---|---|---|
| Semi-Final | T20I (World Cup) | Wankhede, Mumbai | India won by 7 runs |
| 1st T20I | T20I | Chester-le-Street | No result (rain) |
| 2nd T20I | T20I | Old Trafford | England won by 4 wickets |
| 3rd T20I | T20I | Trent Bridge | England won by 125 runs |
| 4th T20I | T20I | Bristol | England won by 9 wickets |
| 5th T20I | T20I | Southampton | England won by 56 runs |
| 1st ODI | ODI | Edgbaston | India won by 6 wickets |
| 2nd ODI | ODI | Cardiff | England won by 4 wickets |
| 3rd ODI | ODI | Lord’s | England won by 27 runs |
T20I series: England won 4-0. ODI series: England won 2-1.
T20 World Cup Semi-Final Scorecard: Analysis & Key Moments
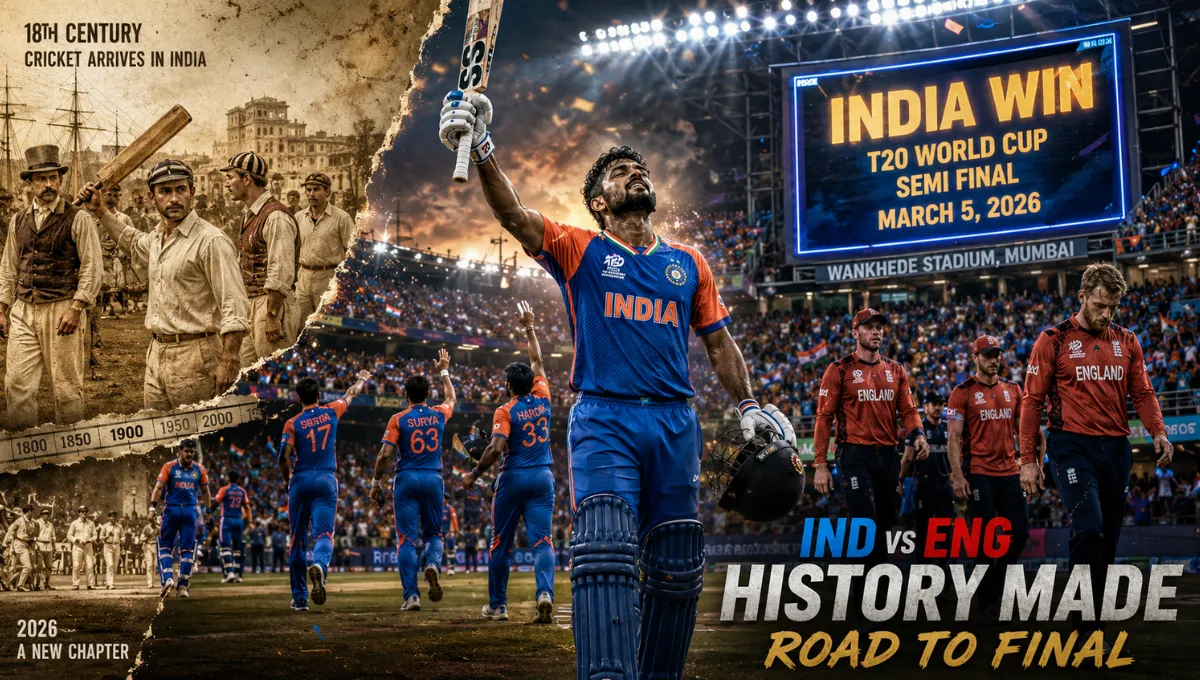
India 253/7 (20 overs) beat England 246/7 (20 overs) by 7 runs, Wankhede Stadium, Mumbai, March 5, 2026. Combined runs: 499 a T20 World Cup record.
Batting Card: India
| Batter | Runs | Balls | Notes |
|---|---|---|---|
| Sanju Samson | 89 | 42 | India’s top score, set up the total |
| Shivam Dube | 43 | 25 | Middle-overs acceleration |
| Ishan Kishan | 39 | — | Solid support role |
Bowling Card: England
| Bowler | Wickets | Notes |
|---|---|---|
| Will Jacks | 2/40 | Broke a key partnership |
| Adil Rashid | 2/41 | Contained the middle overs |
Batting Card: England
| Batter | Runs | Balls | Notes |
|---|---|---|---|
| Jacob Bethell | 105 | — | Century in a losing cause |
| Will Jacks | 35 | — | Early support |
Bowling Card: India
| Bowler | Wickets | Notes |
|---|---|---|
| Hardik Pandya | 2/38 | Took the crucial 19th-over wickets |
| Jasprit Bumrah | 1/33 | Controlled the death overs |
Read Also:- Sunrisers Hyderabad Vs Punjab Kings Match Scorecard
Turning point: Samson’s acceleration between overs 15-18 added an extra 25-30 runs that India didn’t have in hand at the halfway mark. Without it, England’s chase of 253 becomes a chase of roughly 225 comfortably gettable given Bethell’s form.
This is where things go wrong for chasing sides against a good total: you can match a par score, but you can’t match a total that got fifteen runs better than par in the last five overs.
T20I Series: Match-by-Match Scorecards
2nd T20I Scorecard: Old Trafford, Manchester
England 191/6 (19 overs) beat India 190/7 (20 overs) by 4 wickets.
- India’s total of 190 was built on contributions from Ishan Kishan and Abhishek Sharma in the top order.
- Jacob Bethell’s unbeaten 76 off 46 balls chased down the target with an over to spare.
- Arshdeep Singh took 3 wickets but couldn’t stop the chase alone.
Turning point: Bethell was dropped early in his innings a missed chance that turned a contained chase into a canter. One dropped catch, one match swung.
3rd T20I Scorecard: Trent Bridge, Nottingham (India’s Batting Collapse)
England 201/7 (20 overs) beat India 76 all out (11.4 overs) by 125 runs.
Batting Card: England
| Batter | Runs | Balls | SR |
|---|---|---|---|
| Phil Salt | 70 | — | — |
| Sam Curran | 41* | — | — |
Bowling Card: India
| Bowler | Wickets | Figures |
|---|---|---|
| Prince Yadav | 2 | 2/30 |
| Harshit Rana | 2 | 2/40 |
Batting Card: India
| Batter | Runs | Balls |
|---|---|---|
| Vaibhav Sooryavanshi | 13 | — |
| Ishan Kishan | 13 | — |
Bowling Card: England
| Bowler | Wickets | Figures |
|---|---|---|
| Josh Tongue | 4 | 4/28 |
| Jofra Archer | 3 | 3/29 |
Common mistake in reading this scorecard: treating 76 all out as a “collapse from nowhere.” It wasn’t. India lost wickets in clusters from ball one Tongue and Archer’s new-ball spell inside the first six overs did the real damage, and the middle order never got a platform to rebuild from. The scorecard shows a total; the ball-by-ball data shows a top-order failure against extreme pace, which is a completely different problem to fix.
4th T20I Scorecard: Bristol
England 159/1 (13.5 overs) beat India 158/7 (20 overs) by 9 wickets.
Batting Card: India
| Batter | Runs | Balls | SR |
|---|---|---|---|
| Shreyas Iyer (c)* | 80 | 49 | 163.27 |
| Shivam Dube | 22 | 23 | 95.65 |
| Abhishek Sharma | 16 | 14 | 114.29 |
| Vaibhav Sooryavanshi | 15 | 10 | 150.00 |
| Tilak Varma | 11 | 8 | 137.50 |
| Washington Sundar | 5 | 8 | 62.50 |
| Axar Patel | 1 | 2 | 50.00 |
Batting Card: England
| Batter | Runs | Notes |
|---|---|---|
| Harry Brook | 79* | Unbeaten, chased in under 14 overs |
| Phil Salt | 59* | Opening blitz set the tone |
Read Also:- Sunrisers Hyderabad Vs Delhi Capitals Match Scorecard
Turning point: Iyer’s unbeaten 80 off 49 was the only substantial Indian innings, but it came too late in a total that needed support from at least one more batter. Brook and Salt then chased 159 without losing a second wicket the fastest and most one-sided chase of the series.
5th T20I Scorecard: Southampton
England 257/3 (20 overs) beat India 201/8 (20 overs) by 56 runs.
- Jos Buttler (131) and Harry Brook (95*) added a stand of 233 for the second wicket a series-defining, record partnership.
- Ishan Kishan (56) and Tilak Varma (53) gave India a fighting reply, but 257 was always going to be out of reach.
Turning point: the Buttler-Brook stand’s first ten overs, where England scored at nearly 13 runs per over without losing a wicket. That single passage of play made the chase mathematically improbable before India’s innings even began.
ODI Series: Match-by-Match Scorecards
1st ODI Scorecard: Edgbaston, Birmingham
India 262/4 (45.2 overs) beat England 258 all out (47.5 overs) by 6 wickets.
India chased down the target with more than four overs to spare, giving no early hint of what was to follow in the next two matches. This is the result competitors bury under generic “India wins opener” headlines, without flagging that it made England’s eventual 2-1 series win a genuine comeback.
2nd ODI Scorecard: Cardiff
England 235/6 (44.1 overs) beat India 233 all out (44 overs) by 4 wickets.
Joe Root’s unbeaten 99 was the difference a chase built almost entirely around one batter absorbing pressure while partners rotated around him. India’s total of 233 was competitive but not enough once Root found his rhythm in the middle overs.
Turning point: Root remaining unbeaten through two separate partnership resets. Most chases fail when the anchor batter loses partners; this one succeeded because Root simply outlasted India’s bowling changes.
3rd ODI Scorecard: Lord’s, London (Record Run-Fest)
England 387/3 (50 overs) beat India 360/7 (50 overs) by 27 runs.
Batting Card: England
| Batter | Runs | Balls | 4s | 6s | SR |
|---|---|---|---|---|---|
| Ben Duckett | 141 | 135 | 18 | 1 | 104.44 |
| Jacob Bethell | 91 | 93 | 11 | 2 | 97.84 |
| Joe Root | 74 | 48 | — | — | — |
| Jos Buttler | 41 | 13 | — | — | — |
Bowling Card: India
| Bowler | Wickets | Figures |
|---|---|---|
| Prasidh Krishna | 2 | 2/69 |
| Prince Yadav | 1 | 1/79 |
Batting Card: India
| Batter | Runs | Balls | SR |
|---|---|---|---|
| Rohit Sharma | 138 | 110 | — |
| Shubman Gill (c) | 77 | 84 | — |
| Virat Kohli | 74 | 60 | — |
Bowling Card: England
| Bowler | Wickets | Figures |
|---|---|---|
| Sam Curran | 4 | 4/75 |
| Jacob Bethell | 1 | 1/49 |
| Jofra Archer | 1 | 1/63 |
| Adil Rashid | 1 | 1/64 |
What people think vs reality: the headline reads “India lose by 27 runs,” which sounds like a batting failure.
Reality: Rohit, Gill, and Kohli all passed fifty, and 360 is one of India’s highest-ever ODI totals in a losing chase. The actual failure was on the bowling side Duckett’s 141 and the Bethell-Root stand of over 100 runs came off an attack that had no answer once the ball stopped seaming after the first 15 overs.
Cross-Series Player Performance Breakdown
| Player | Team | Best Scorecard Entry in 2026 |
|---|---|---|
| Sanju Samson | India | 89 (42) — Semi-Final |
| Shreyas Iyer | India | 80* (49) — 4th T20I |
| Rohit Sharma | India | 138 (110) — 3rd ODI |
| Jos Buttler | England | 131 (13 balls faced, part of 233-run stand) — 5th T20I |
| Ben Duckett | England | 141 (135) — 3rd ODI |
| Jacob Bethell | England | 105 (Semi-Final), 91 (3rd ODI), 76* (2nd T20I) — most consistent across formats |
Bowling Economy Leaderboard Across All 9 Matches
| Bowler | Team | Standout Figures |
|---|---|---|
| Josh Tongue | England | 4/28 — best single bowling card of the year vs India |
| Sam Curran | England | 4/75 at Lord’s, plus 3/36 in the T20I finale |
| Jofra Archer | England | 3/29 in the Trent Bridge collapse, plus wickets in three other matches |
| Hardik Pandya | India | 2/38 in the Semi-Final’s decisive final overs |
| Prasidh Krishna | India | 2/69 at Lord’s — India’s most successful ODI bowler in the series decider |
Read Also:- Bangladesh National Cricket Team Vs New Zealand National Cricket Team Match Scorecard
What the Scorecards Really Reveal
Three original observations from reading all nine cards together:
- India’s batting was never the problem across the calendar year Samson, Iyer, Rohit, Gill, and Kohli all produced series-best or near-best innings at different points. The recurring failure was bowling depth beyond the first-change option, visible in every match England won convincingly.
- England’s real weapon in 2026 wasn’t a single star; it was rotation. Bethell contributed match-defining knocks in three different formats and matches, which is rarer than any single big century.
- Reading India’s 76 all out and 360/7 as the “same kind of failure” is a mistake competitors keep making. One was a technical collapse against pace; the other was a genuinely good batting performance let down by bowling. Treating them identically in analysis misses the actual fix each result demands.
frequently asked questions (FAQs)
Q1. What was the full scorecard of the India vs England T20 World Cup semi-final?
Ans. India scored 253/7, led by Sanju Samson’s 89 and Shivam Dube’s 43. England replied with 246/7, built around Jacob Bethell’s 105. India won by 7 runs.
Q2. Why was India bowled out for 76 against England?
Ans. India lost wickets in clusters inside the first six overs of the 3rd T20I at Trent Bridge, as Josh Tongue (4/28) and Jofra Archer (3/29) exploited early pace and movement. The middle order never got the platform to rebuild.
Q3. What was the scorecard of the 3rd ODI at Lord’s?
Ans. England scored 387/3, with Ben Duckett’s 141 and Jacob Bethell’s 91 leading the innings. India replied with 360/7, featuring Rohit Sharma’s 138, Shubman Gill’s 77, and Virat Kohli’s 74, but fell 27 runs short.
Q4. Who had the best bowling figures against India in 2026?
Ans. Josh Tongue’s 4/28 in the 3rd T20I at Trent Bridge was the standout bowling performance across the year, directly causing India’s lowest total of the calendar.
Q5. What was India’s highest score in the England series 2026?
Ans. India’s highest total was 360/7 in the 3rd ODI at Lord’s, though it came in a losing cause chasing 388.


Leave a Reply